In 1998, the Alaska Volcano Observatory had a simple electronic alarm connected to just eight seismic stations along the entire Aleutian arc. When it went off at home, the duty seismologist had to drive to the observatory to find out why. In Fairbanks or Anchorage, that could mean driving on icy roads in the middle of a winter night. The journey cost time just when a volcano might be changing, and it put the person on duty at risk.
I developed IceWeb at the observatory that year. It was the first web-based seismic monitoring system for volcanoes. Its tremor alarm tracked more than 100 stations along the arc. When an alarm sounded, the duty seismologist could open a browser at home and begin assessing the activity immediately.
What could you tell from home?
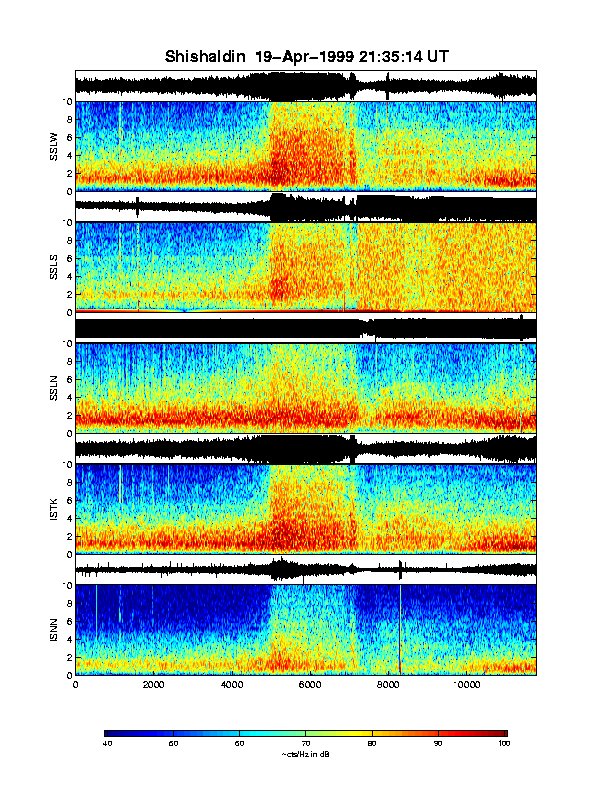
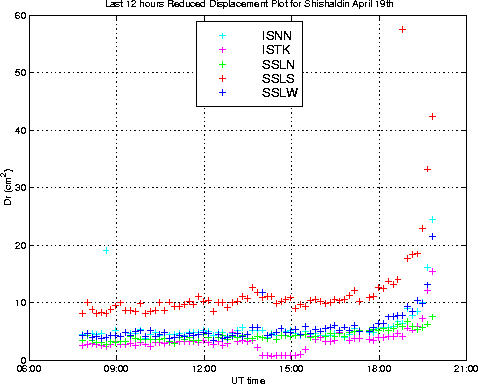
The spectrogram browser placed recordings from several stations side by side for the same time interval. On a helicorder plot, an increase in shaking might be obvious. In the mosaic you could also see which frequencies had strengthened, when the change began, and whether other stations showed the same pattern. Reduced displacement plots showed how the strength of the tremor evolved over longer intervals, e.g. the last week. Together these views made it much easier to judge what had triggered an alarm.
You could also change every alarm setting through the web interface. If a faulty station kept generating false alarms, you could take it out of the alarm system altogether while the other stations continued monitoring.
Shishaldin, 19 April 1999
These two IceWeb displays show the same eruption on different time scales.
Versions and code
- Original IceWeb source — the Alaska system developed in 1998–2000 and used from 1998 to 2007.
- Community IceWeb repository — the revised system used from 2008 to 2020.
- icewebPy — Python implementation.
The USGS Pensive application is a Java clone of IceWeb’s rapid spectrogram browser. Pensive does not include IceWeb’s other components, such as its web-configurable tremor alarms, reduced displacement plots, and digital helicorder displays. See also my other observatory software.